Table of Contents
- Removing the Protected Attribute Does Nothing
- Where Bias Actually Enters
- The Incompatibility Result
- Three Definitions and What They Mean
- Choosing Deliberately
- Auditing a Model in Practice
- Mitigation at Three Stages
- Documentation That Survives Turnover
- Common Pitfalls
- Conclusion
- Frequently Asked Questions
Key takeaway: Equal outcome rates, equal error rates, and calibration cannot all hold simultaneously when base rates differ between groups. This is a mathematical theorem, not an engineering limitation, and it forces an explicit choice about which fairness property matters for your application.
Removing the Protected Attribute Does Nothing
The first instinct when building a model that must not discriminate is to remove the sensitive attribute. Delete the race column, drop gender, and the model cannot discriminate on what it cannot see.
This does not work, and understanding why is the foundation for everything else.
Protected attributes are encoded redundantly throughout typical datasets. Postal code correlates strongly with race in many countries due to historical residential segregation. First names carry gender and ethnic signal. Purchase categories, browsing patterns, device type, and time-of-day activity all carry demographic information. A model with sufficient capacity reconstructs the removed attribute from its correlates and uses it.
Worse, removing the attribute makes discrimination harder to detect. You cannot measure disparate impact across a group you have no data on. Blindness eliminates your ability to audit while leaving the discriminatory capacity intact.
This is why practitioners in this area consistently recommend the opposite: collect protected attributes where legally permitted, exclude them from model features if appropriate, and use them extensively for measurement. You need the data to know whether the model is fair, even when you must not use it to decide.
The distinction is between using an attribute for prediction and observing it for evaluation. These are separable, and conflating them produces systems nobody can audit.
Where Bias Actually Enters
Bias is not a single defect located in one place. It enters at several points, and each requires a different response.
Historical bias in the target variable. If your labels come from past human decisions, they encode those decisions’ biases. A hiring model trained on who was previously hired learns previous hiring preferences. The model is accurately predicting a biased process — the data is faithful and the process it describes was unfair.
Representation bias in the sample. Groups underrepresented in training data receive worse predictions, because the model had less signal about them. This is why systems frequently perform worse for minority populations even with no discriminatory intent anywhere.
Measurement bias in the features. A proxy measured differently across groups introduces distortion. Using arrest records as a proxy for criminal behaviour imports enforcement disparities directly into the feature.
Aggregation bias. One model applied to populations with genuinely different underlying relationships fits the majority and underperforms elsewhere.
Deployment bias. A model used differently than intended, or applied to a population it was not validated on. A model built for one country deployed in another is a common instance.
Feedback loop bias. Predictions influence future data. Predictive policing directing patrols to certain areas produces more recorded incidents there, confirming the prediction and amplifying it over time. This is the most insidious category because the model appears to be improving.
Note that only some of these are addressable by changing the model. Historical bias in labels is a data problem. Feedback loops are a system design problem. Reaching for algorithmic mitigation on a problem rooted in the target variable does not work.
The Incompatibility Result
Here is the fact that reframes the entire discussion, and it is not widely enough known outside the research literature.
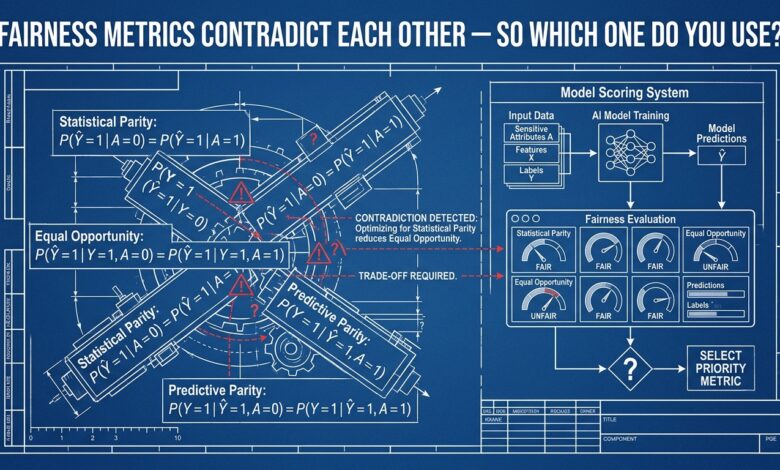
Several intuitive fairness definitions are mathematically incompatible. When base rates differ between groups — that is, when the actual prevalence of the outcome differs — you cannot simultaneously achieve equal positive prediction rates, equal false positive and false negative rates, and calibration within each group.
This is a proven impossibility result, not a limitation of current techniques. No future algorithm resolves it. The three properties are in direct mathematical tension whenever base rates differ, which in practice is nearly always.
The implication is uncomfortable and clarifying. Any deployed model embodies a choice among these properties. Teams that have not made the choice explicitly have still made it — by accident, through whichever metric they happened to optimise. The question is never whether to trade off, only whether the trade-off is deliberate and documented.
This is why fairness cannot be delegated to engineering as a technical requirement. “Make the model fair” is not a specification. “Equalise false negative rates across groups, accepting unequal positive prediction rates” is a specification, and choosing between such statements requires domain and values judgement rather than modelling skill.
Three Definitions and What They Mean
The main candidates, with their practical implications:
Demographic parity. Equal rates of positive prediction across groups. Appropriate when you believe base rate differences themselves reflect historical injustice rather than genuine difference — for instance, if past discrimination suppressed qualification rates in a group. The cost is that it can require different decision standards across groups, which raises legal questions in some jurisdictions.
Equalised odds. Equal true positive and false positive rates across groups. Appropriate when errors carry serious consequences and you want the burden of error distributed evenly. This is the most commonly appropriate choice for high-stakes decisions about individuals.
Calibration within groups. A predicted probability of 0.7 means the same actual likelihood in every group. Appropriate when the score is used for downstream decisions by humans who need to interpret it consistently. A miscalibrated score misleads whoever reads it.
| Definition | Equalises | Best suited to | Main objection |
|---|---|---|---|
| Demographic parity | Selection rates | Redressing historical exclusion | May require different standards |
| Equalised odds | Error rates | High-stakes individual decisions | Reduces overall accuracy |
| Calibration | Score meaning | Scores read by human decision-makers | Permits unequal selection rates |
A fourth consideration cuts across all three: individual fairness, the principle that similar individuals should receive similar predictions. This is intuitive and difficult to operationalise, because defining similarity requires exactly the domain judgement that the fairness question was trying to formalise.
Choosing Deliberately
A procedure that produces defensible decisions:
Identify who is affected and how. Which groups, and what happens to someone the model treats wrongly. A false negative on a loan application and a false negative on a medical screening have entirely different weight.
Determine which error is worse, for whom. In screening applications, false negatives usually harm the individual and false positives usually cost the institution. That asymmetry should drive the choice.
Involve people beyond the engineering team. Legal, domain experts, and where feasible representatives of affected groups. Engineers can compute any metric and are not positioned to decide which one encodes the right values.
Consider base rate differences carefully. If they exist, ask whether they reflect genuine difference or measurement and historical artefacts. This question determines whether demographic parity is appropriate or misguided.
Document the decision and its reasoning. This is the artefact that matters most, because it is what allows the decision to be revisited, challenged, and defended later.
Auditing a Model in Practice
Concretely, what an audit involves:
Disaggregate every metric. Overall accuracy conceals group-level failures by construction. Report precision, recall, false positive rate, false negative rate, and calibration separately for each group.
Check intersections, not only single attributes. A model can appear fair on gender and on race separately while failing badly for a specific combination. This is a well-documented pattern and it is invisible in single-attribute analysis.
Test at the deployed threshold. Fairness properties vary with threshold. A model fair at 0.5 may not be at 0.3, and the deployed threshold is the only one that matters.
Examine representation before blaming the model. If a group constitutes 2 percent of training data, poor performance for them is expected. Fix the data before adjusting the algorithm.
Evaluate the whole decision system. The model is one component. Human override patterns, appeal processes, and how the score is presented all affect outcomes, and biases can enter at any of them.
# The minimum useful audit output
for group in groups:
    mask = (data.group == group)
    report(group,
        n            = mask.sum(),
        base_rate    = labels[mask].mean(),
        selection    = (scores[mask] >= threshold).mean(),
        fnr          = false_negative_rate(scores[mask], labels[mask], threshold),
        fpr          = false_positive_rate(scores[mask], labels[mask], threshold),
        calibration  = calibration_error(scores[mask], labels[mask]),
    )
Small group sizes deserve attention when reading these numbers. A false negative rate computed on 40 examples has wide confidence intervals, and reporting it without that caveat invites false conclusions in both directions.
Mitigation at Three Stages
Interventions are available before, during, and after training.
Pre-processing. Reweight or resample to balance representation, or transform features to reduce correlation with protected attributes. Advantage: model-agnostic, and it addresses representation bias at its source. Limitation: cannot fix bias in the target variable.
In-processing. Add a fairness constraint or penalty to the training objective. Advantage: directly optimises the property you selected. Limitation: requires modifying training, and the accuracy cost is explicit.
Post-processing. Adjust thresholds per group to equalise the chosen metric. Advantage: simplest to implement, works on an existing model. Limitation: applying different thresholds by group is legally problematic in some jurisdictions and contexts.
There is no universally correct stage. Post-processing is most practical for existing systems; pre-processing addresses the underlying data problem; in-processing gives the most direct control at the highest implementation cost.
What none of them fix: bias in the labels themselves. If your target variable encodes past discrimination, every mitigation technique is adjusting how faithfully you reproduce it. That problem requires changing what you predict, not how you predict it — and that is a product decision.
Documentation That Survives Turnover
The artefact with the longest useful life is a written record of what the model does, on whom it was validated, and which fairness choice was made.
A useful model card covers the intended use and explicit out-of-scope uses; the training data’s sources, time period, and demographic composition; performance disaggregated by group; the fairness definition selected and why; known limitations and populations where performance is weaker; and the date of the last audit.
The out-of-scope section is the one teams skip and the one that prevents the most harm. Deployment bias — using a model on a population it was never validated for — is among the most common failure modes, and it usually happens because nobody wrote down where the model does not apply.
Common Pitfalls
Removing protected attributes and declaring the problem solved. Proxies remain; auditing becomes impossible.
Optimising a fairness metric without choosing it deliberately. You have made a values decision by accident.
Reporting only aggregate performance. Group-level failures are invisible in totals.
Ignoring intersectional groups. Single-attribute fairness can coexist with severe failure for specific combinations.
Treating fairness as a launch checklist item. Distributions shift, so fairness properties degrade over time and require re-auditing.
Assuming a technical fix for a data problem. Historical bias in labels is not addressable by algorithmic mitigation.
Conclusion
The central fact of algorithmic fairness is that the intuitive definitions are mutually incompatible when base rates differ. That is a theorem. Every deployed model therefore embodies a choice, and the only question is whether that choice was made deliberately.
Making it deliberately means collecting protected attributes for measurement even when excluding them from features, disaggregating every metric by group and by intersection, selecting a fairness definition with input from beyond the engineering team, documenting the reasoning, and re-auditing as distributions shift.
None of this makes a model fair in an absolute sense, because no such state exists. What it produces is a system whose trade-offs are known, recorded, and defensible — which is a substantially better position than a model whose fairness properties nobody has measured.
Frequently Asked Questions
Can a model be fair by every definition simultaneously? Only when base rates are identical across groups, which is rare in practice. Otherwise the definitions are provably incompatible and you must choose.
Should protected attributes be collected at all? Where legally permitted, yes — for measurement. You cannot audit for disparate impact across groups you have no data on. Excluding them from model features while retaining them for evaluation is the standard approach.
Does higher accuracy make a model fairer? No. A highly accurate model can be highly discriminatory, particularly when it accurately predicts a biased historical process. Accuracy and fairness are distinct properties.
How often should fairness be re-audited? On every significant model update, and periodically regardless — quarterly for high-stakes applications. Population distributions shift, which changes fairness properties without any change to the model.
Who decides which fairness definition to use? Not engineering alone. It is a values and policy question requiring domain expertise, legal input, and ideally representation from affected groups. Engineers implement and measure the choice.
What if fairness constraints reduce accuracy significantly? That is the trade-off made visible, which is progress rather than a problem. Whether the accuracy cost is acceptable depends on what the errors do to people, which is precisely the discussion the constraint forces.
Are there fairness issues in generative models too? Yes, and they are harder to measure. Representational harms in generated text and images, differential quality across languages and dialects, and stereotype reproduction are all documented. The metrics discussed here apply to classification and do not transfer directly.